
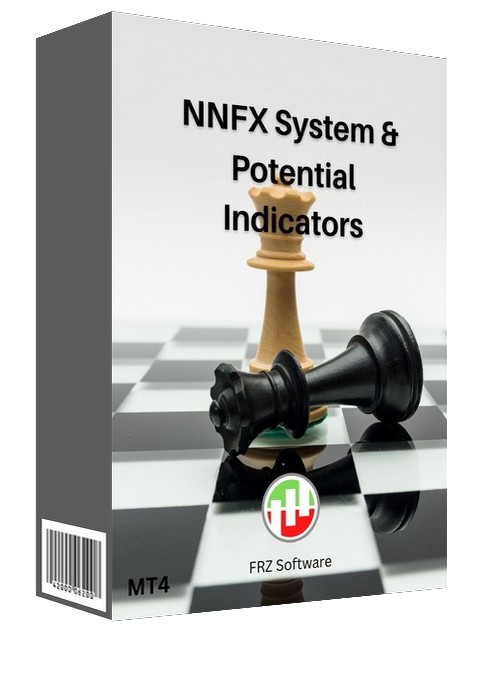
Description
No Nonsense Forex (NNFX) Strategy Guide & Free Indicators for MT4 & MT5
The No Nonsense Forex (NNFX) method is an indicator-based, trend-following trading method with clearly defined money and risk management rules. This page summarizes the full NNFX method and gives you a free pack of FRZ indicators for MT4 and MT5 that fill each role in the NNFX setup, so you can start building and testing your own NNFX algorithm straight away.
FRZ Software is not affiliated with the creator of the No Nonsense Forex method. This is an independent summary of the publicly described method.
Want NNFX fully automated? See our FRZ No Nonsense Forex EA.
The NNFX Method in a Nutshell
An NNFX algorithm is built from 6 types of indicators:
- ATR Indicator
- Baseline Indicator
- 1st Confirmation Indicator
- 2nd Confirmation Indicator
- Volume Indicator
- Exit Indicator
A trade is entered only when the baseline, both confirmation indicators and the volume indicator all agree. Every decision is made on the last closed candle, never on the candle that is still forming. The creator of the method has never disclosed the exact indicators and settings he uses, so every trader needs to back test and forward test different indicator and setting combinations before trading real money.
The idea behind NNFX is simple: no single indicator is reliable on its own, but a small team of indicators that each do one job – measure volatility, define the trend, confirm the direction, check there is enough movement and time the exit – can filter out most bad trades. Combined with strict, fixed risk on every trade, the aim is a method that stays profitable even when only around half of the trades win.
The 6 NNFX Indicator Roles Explained
- ATR Indicator
The Average True Range measures how far price typically moves per candle. NNFX uses the 14-period ATR to size stop losses, take profits and positions. - Baseline Indicator
The primary decision indicator, usually a moving average or another line indicator. A close above the baseline is a buy signal and a close below it is a sell signal. One extra condition: price must not be more than 1 x ATR away from the baseline when you enter. - Confirmation Indicators
Any indicator that is not one of the “dirty dozen” can be used. Back test your candidates and keep the ones that work best with the best settings. - Volume Indicator
NNFX is trend-following, and trends need volume and movement. This indicator gives the go-ahead only when the market is active enough to trade. NNFX also mentions the Euro VIX index: a reading below about 7-8 suggests there is not enough movement. Using it is optional. - Exit Indicator
Tells you when to exit a trade. The baseline and the two confirmation indicators can also signal an exit: if any of them shows an opposite signal while you are in a trade, you close it.
The “Dirty Dozen” – What NNFX Avoids
NNFX drops some of the most popular indicators and concepts in forex trading. These 12, known as the “dirty dozen”, should be avoided altogether:
- ADX (Average Directional Index)
- Trend lines
- Stochastics (NNFX drops the overbought/oversold concept altogether)
- Price levels
- CCI
- Support & resistance lines
- Japanese candlestick patterns
- Chart patterns (e.g. double top, head & shoulders, harmonics)
- Bollinger Bands
- Fibonacci
- RSI
- Moving average crossovers
Core NNFX Trading Rules
Timeframe: NNFX strictly uses the daily chart. Higher timeframes give cleaner signals, lower spreads relative to the move and far less screen time.
When to check the charts: Once a day, shortly before the daily candle closes (around 15-20 minutes before the 5 pm New York close). Evaluate the candle that is about to close as if it has closed, then place or manage your trades. Outside that window, there is nothing to do.
Use of ATR: NNFX uses the 14-period ATR for all its measurements, read from the daily candle.
Stop loss: 1.5 x ATR from the entry price. For example, if the ATR is 60 pips, the stop loss is 90 pips.
Take profit: 1 x ATR, applied to half of the position (see the two-order method below).
Lot size: Risk no more than 2% of your capital per trade, measured from entry to stop loss. Because the stop loss is based on ATR, the lot size automatically shrinks on volatile pairs and grows on quiet ones, so every trade carries the same risk.
Related pairs: Avoid concurrent trades in related pairs. For example, if you have a EURUSD trade open, do not open a new trade that includes USD or EUR in the same direction of exposure. If you do take concurrent trades in related pairs, reduce the risk on them (for example to 1% of your capital each).
News: Do not open new trades when high-impact news is due in the next 24 hours. NNFX only counts the news events that usually cause major moves, such as US NFP, interest rate decisions and central bank speeches.
The Two-Order Money Management Method
NNFX splits every trade into two equal orders, each risking half of the total (for example 1% + 1% for a 2% trade):
- Order 1 has a stop loss of 1.5 x ATR and a take profit of 1 x ATR.
- Order 2 has the same 1.5 x ATR stop loss but no take profit – it is the “runner”.
When Order 1 hits its take profit, move Order 2’s stop loss to break even. From that point the trade can no longer lose money. Order 2 then stays open until one of these happens:
- the exit indicator, baseline or a confirmation indicator gives an opposite signal,
- price returns to the break-even stop, or
- a trailing stop closes it. The trailing stop starts only after price has moved 2 x ATR in your favour, and then typically follows price at 1.5 x ATR.
This is what makes the method work: Order 1 locks in a steady stream of small wins, and Order 2 catches the occasional big trend that pays for many losing trades.
Worked Example
Account balance: $10,000. Risk: 2% = $200, split $100 per order. EURUSD daily ATR: 60 pips.
- Stop loss = 1.5 x 60 = 90 pips. Take profit for Order 1 = 1 x 60 = 60 pips.
- Risk per order = $100 / 90 pips = about $1.11 per pip = about 0.11 lots each (at roughly $10 per pip per standard lot).
- If both orders hit the stop loss: -$200 (2%).
- If Order 1 hits its take profit: +$66, and Order 2’s stop moves to break even. Worst case from here is a small +$66 win; best case is a large trend win from the runner.
NNFX Entry Types
1. Standard entry
Your 1st confirmation indicator gives a signal, and price is already on the same side of the baseline. The 2nd confirmation indicator and the volume indicator also agree, and price is within 1 x ATR of the baseline. All conditions met: enter at the daily close.
2. Baseline cross entry
Price closes across the baseline. Enter if the 1st confirmation indicator already agrees with the new direction (and gave its signal recently), the 2nd confirmation and volume indicators agree, and price is within 1 x ATR of the baseline.
3. Pullback entry
Everything agrees, but the signal candle closed more than 1 x ATR away from the baseline – price has stretched too far, so you skip the entry. If the next candle pulls back to within 1 x ATR of the baseline and all indicators still agree, you can take the trade then.
4. Continuation trade
After a trade in a trend has ended, if price is still on the same side of the baseline (the baseline has not been crossed) and the 1st confirmation indicator signals again in the trend direction, you can re-enter. Continuation trades follow an already-confirmed trend, so the volume indicator check is usually not required.
The one candle rule
If your 1st confirmation indicator signals but one of the other indicators agrees one candle later, you can still take the trade on that next candle – as long as everything else still agrees and price has not moved against you.
The 7 candle rule (“a bridge too far”)
If the baseline cross happened 7 or more candles before your 1st confirmation indicator signals, the trend is considered too old and the trade is skipped.
How to Build and Test Your NNFX Algorithm
NNFX is not a fixed set of indicators – it is a framework for finding your own. The usual approach is to test one component at a time, in this order:
- 1st confirmation indicator first. Test it on its own: enter on every signal, use the 1.5 x ATR stop loss and 1 x ATR take profit, and record the results over at least 2 years of daily data on several pairs. Keep only the indicators that clearly beat random entries.
- Baseline. Add a baseline and check that it removes more losing trades than winning ones.
- 2nd confirmation indicator. Pick one that agrees with your 1st confirmation but calculates differently, so it filters rather than duplicates.
- Volume indicator. Test whether it keeps you out of flat, choppy markets without cutting too many good trades.
- Exit indicator. Finally, test which exit gets the most out of the runner order.
After back testing, forward test the full algorithm on a demo account for several weeks before trading real money. Change one thing at a time – if you change two indicators at once, you cannot tell which change made the difference.
Common NNFX Mistakes
- Trading on the forming candle instead of the daily close.
- Entering when price is more than 1 x ATR from the baseline (chasing).
- Raising risk after a losing streak, or skipping the two-order split.
- Opening several trades in pairs that share the same currency at full risk.
- Using “dirty dozen” indicators as confirmations.
- Changing the algorithm after every losing trade instead of testing properly.
Build Your NNFX Setup with Free FRZ Indicators
The free download on this page contains the FRZ indicators below for both MT4 and MT5. None of them is on the “dirty dozen” list, and each one has its own page with full settings.
| NNFX Role | FRZ Indicator | How to use it |
|---|---|---|
| ATR | FRZ ATR Bands Indicator | Set the ATR Period to 14. Set the band multipliers to 1.0 and 1.5 to see your NNFX take profit and stop loss distances right on the chart. |
| Baseline | FRZ Hull Moving Average Indicator | A fast, smooth baseline. Buy on a close above the line, sell on a close below it. |
| Baseline (alternative) | FRZ Colored Moving Average Indicator | A moving average that changes color with its direction, with a choice of MA method and an optional flat threshold. |
| Confirmation | FRZ Bull Bear Pressure Indicator | Confirms the side when the net pressure line is above zero (buy) or below zero (sell), with an optional alert when it changes side. |
| Volume / no-trade filter | FRZ Ranging Market Indicator | Marks sideways zones on the chart. Skip new entries while the last closed candle is still inside a range. |
| Exit | FRZ Hull Moving Average Indicator or FRZ Bull Bear Pressure Indicator | Exit when the Hull line turns against your trade or net pressure changes side. |
| News rule | FRZ News Indicator | Shows upcoming high-impact news for the chart’s currencies, so you can apply the NNFX 24-hour news rule. On MT4, tick Allow DLL imports when attaching it. |
The second confirmation indicator is your own choice – test a few candidates against your baseline and first confirmation before trading live.
Automate It with the FRZ No Nonsense Forex EA
Testing NNFX combinations by hand on daily charts takes a long time. The FRZ No Nonsense Forex EA trades the NNFX approach for you across multiple currency pairs, with ATR-based stop loss and take profit, automatic avoidance of correlated pairs and built-in drawdown recovery.
FAQ
Is this free?
Yes. The guide and the indicator pack are completely free, with no license needed.
Does it work on MT4 and MT5?
Yes. The download contains an MT4 folder and an MT5 folder with every indicator.
Are these the exact indicators the NNFX creator uses?
No. The creator has never disclosed his indicators or settings. These FRZ indicators fit the NNFX roles and avoid the “dirty dozen”, but you should back test and forward test your own combination.
Does this place trades automatically?
No. The indicators show signals on the chart. For automated NNFX trading, see the FRZ No Nonsense Forex EA.
How do I install the indicators?
In MetaTrader, click File > Open Data Folder, open MQL4Indicators (MT4) or MQL5Indicators (MT5), and copy in the files from the matching folder of the download. Restart MetaTrader (or right-click Indicators in the Navigator and choose Refresh), then drag the indicators onto a daily chart.
Which timeframe should I use?
NNFX is designed for the daily chart.
Recommended Broker & VPS
We recommend using a low-spread broker and a reliable VPS.
- Recommended Broker: IC Markets. If ICMarkets not available in your country, please use IC Trading.
- Recommended VPS Provider: Contabo VPS.
You may contact us on live chat in case you need any support in this regard.
Support & Updates
All paid customers receive:
✔ Free lifetime updates
✔ Access to detailed user manuals
✔ Free remote installation support for first installation
✔ AI-based technical support
✔ General live chat and email ticket support
✔ Discord user forum support
You may check out our full Support Policy for more details.
Risk Disclaimer
Trading in financial markets involves substantial risk and may not be suitable for all investors. Our software is provided “as is” without any guarantee of profit. You are advised to test thoroughly on demo accounts before trading live. Please review our full terms and conditions before purchasing.
Related Trading Categories
Indicators & Analysis
Trading Systems & Strategies
Last updated 11 November 2026

Januk L –
Thank you.
ying yang –
Thank you for this
Leigh –
Very helpful, thanks 🙂