
FRZ Turbo Scalping System – User Manual
- Related Product: FRZ Turbo Scalping System
- Browse Similar Tools: Trading Systems & Strategies
- Video Guide
- Before You Start
- WebRequest Setup
- Installation
- Quick Specifications
- HUD / On-Chart Panel
- Chart Drawings
- Trade Buttons
- Input Settings
- Set Files
- Troubleshooting
- Support Links
Video Guide
(This video is from an older version that used separate indicator and template files – always consider the written text below as the updated guide. A new video is planned.)
Before You Start
- The system is a single Expert Advisor (EA): it is installed in the Experts folder and attached from the Navigator’s Expert Advisors list. No indicator or template files are needed – the EA draws the bands, arrows, support & resistance zones and news lines itself.
- If you used the previous version, remove the old FRZ Turbo Scalping and FRZ Support & Resistance indicators from your charts, so the drawings are not shown twice.
- It never opens a trade by itself. It shows the signals, zones and news, and trades only when you click a button.
- A valid license is required. The license is checked against your trading account number when the EA starts.
- The EA needs WebRequest access to https://frzserver.com (license check, news and update notices) – see WebRequest Setup below.
- Enable AutoTrading (MT4) or Algo Trading (MT5) so the buttons can place trades.
- One EA per chart. MetaTrader allows only one EA on a chart, so use a separate chart if you run another EA on the same pair.
- Practise on a demo account before trading live.
WebRequest Setup
- Open Tools > Options > Expert Advisors.
- Enable Allow WebRequest for listed URL.
- Add this URL:
https://frzserver.com - Click OK and attach (or re-attach) the EA.
Installation
MT4 Installation
- Download the MT4 version from your account dashboard and unzip it.
- In MT4, click File > Open Data Folder and copy the
.ex4file into MQL4/Experts. - Restart MT4, or right-click Expert Advisors in the Navigator panel and select Refresh.
- Open an M1 or M5 chart of the pair you want to trade and drag the EA onto it. On the Common tab, tick Allow live trading.
- Click the AutoTrading button on the toolbar so it turns green.
MT5 Installation
- Download the MT5 version from your account dashboard and unzip it.
- In MT5, click File > Open Data Folder and copy the
.ex5file into MQL5/Experts. - Restart MT5, or right-click Expert Advisors in the Navigator panel and select Refresh.
- Open an M1 or M5 chart of the pair you want to trade and drag the EA onto it. On the Common tab, tick Allow Algo Trading.
- Click the Algo Trading button on the toolbar so it turns green.
When attached, the EA applies the FRZ chart colours (gray background, lime bullish and red bearish candles). When you remove it, its drawings are deleted.
Quick Specifications
| Product name | FRZ Turbo Scalping System |
| Platform supported | MT4 & MT5 |
| Timeframes supported | Any – M1 or M5 recommended for scalping |
| Trading pair(s) | Any symbol, one chart per symbol – low-spread forex pairs and gold recommended (e.g. EURUSD, GBPUSD, XAUUSD) |
| Suitable market sessions | Any session, but high-volume sessions work best – e.g. EURUSD during the London and New York sessions. Avoid the minutes around high-impact news (the panel warns you). |
| Recommended min. deposit | $100 with 0.01 lots (0.01 lots per $100 of balance). You can use cent accounts as well. |
| Minimum leverage | The higher, the better – use the highest leverage available. However, 1:100 can be recommended as the bare minimum. Consider increasing your deposit if your leverage is only at the bare minimum. |
| VPS requirement | This software needs to run 24/7. A Windows VPS is recommended unless you can keep your own PC running continuously 24/7 – For a VPS, we can recommend this VPS provider. You can purchase the cheapest VPS Windows package with this provider (4GB RAM is usually enough as a minimum). More instructions on buying and setting up VPS are given on our VPS page. |
| Recommended broker | EA works on any broker that offers MetaTrader. However, we can recommend ICMarkets and if it is not available for your country, then we can recommend ICTrading. |
HUD / On-Chart Panel
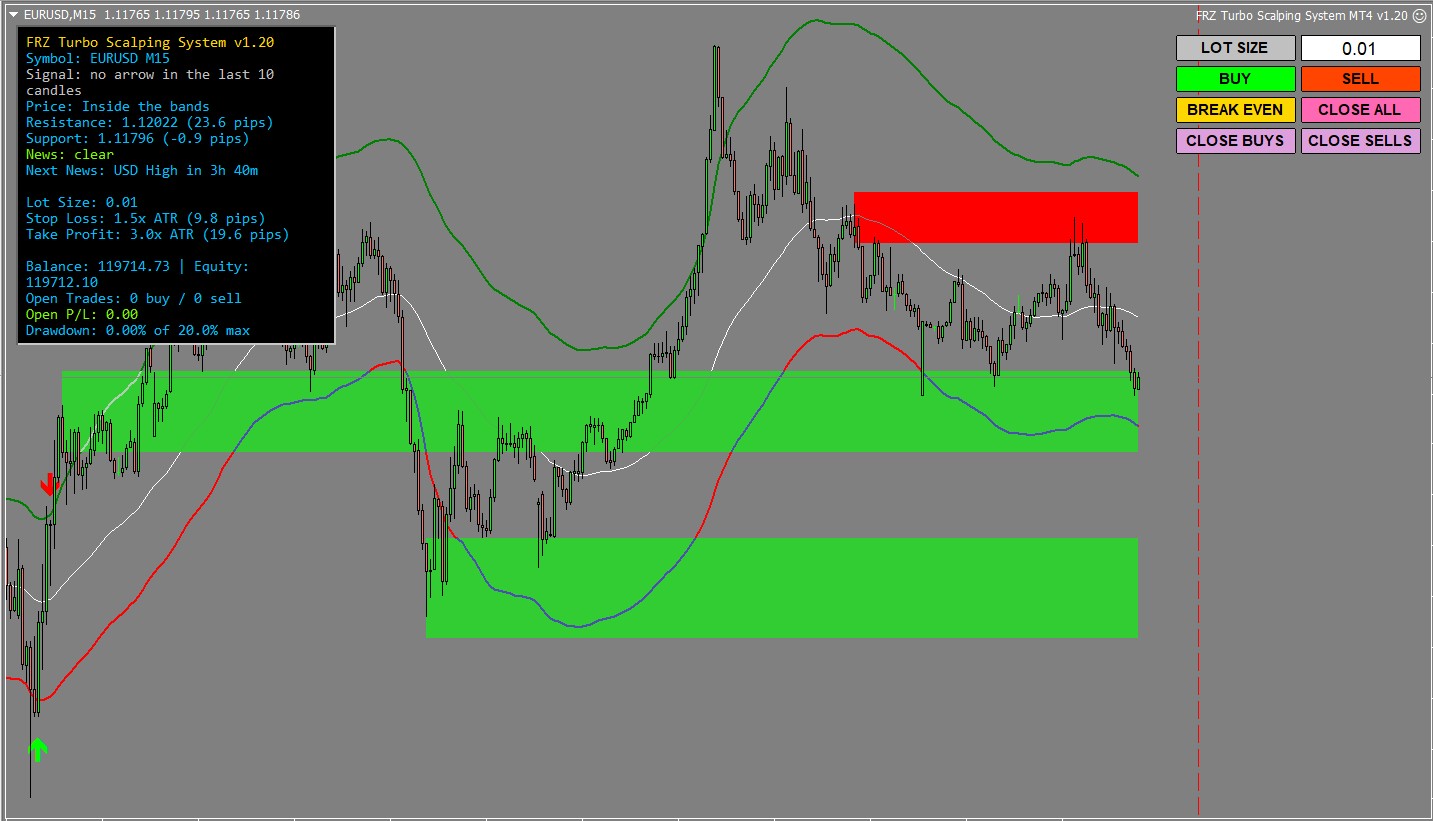
The panel at the top-left of the chart shows the signal, the nearest zones, the news status, your trade settings and your open trades. Long lines wrap onto the next line. Rows marked “only when …” are hidden otherwise.
| HUD Item | Meaning |
|---|---|
| FRZ Turbo Scalping System v… | Product name and the version you are running. |
| Symbol | The chart symbol and timeframe, e.g. Symbol: EURUSD M5. |
| NEWS WINDOW – AVOID NEW TRADES | Red, only when a high-impact news event for the pair’s currencies is within the news window (settings 24-27). Arrow alerts are paused while it shows. The buttons still work – this is a warning, the decision is yours. |
| Signal | Signal: BUY arrow 2 candle(s) ago (green) / Signal: SELL arrow 1 candle(s) ago (red) – the most recent arrow within the last 10 closed candles. “1 candle ago” is the candle that has just closed.Signal: no arrow in the last 10 candles (gray) – wait for the next arrow.Signal: loading history (orange) – MetaTrader is still downloading candles. It clears by itself, usually within seconds. |
| Price | Where the current price is compared with the bands: Inside the bands (blue), Above the upper band (watch for a sell) or Below the lower band (watch for a buy) (orange). Price outside a band means a reversal arrow may follow once a candle turns back. |
| Resistance / Support | The nearest drawn resistance zone above and support zone below the price, with the distance in pips, e.g. Resistance: 1.08745 (12.5 pips) (blue). When price has reached a zone the row turns orange and reads e.g. Support: price inside the zone 1.11700 - 1.11796; once price has passed through it, Support: 1.11700 (price below it) or Resistance: 1.12022 (price above it) until the zones are recalculated at the next candle. none found when no zone of the selected strengths (settings 11-14) exists on that side. Only shown when Show Support & Resistance Zones (setting 9) is true. |
| News / Next News | News: clear (green) or News: inside news window (red), and the next event for the pair’s currencies, e.g. Next News: USD High in 2h 15m or No upcoming news. In the Strategy Tester it reads News: live charts only. Only shown when setting 24 is true. |
| Lot Size / Risk | Lot Size: 0.01 in Fixed Lot Size mode, or Risk: 1.00% per trade in Risk % mode (setting 15) – the value currently in the box next to the buttons. |
| Stop Loss / Take Profit | The stop loss and take profit the BUY / SELL buttons will set, as an ATR multiple and in pips, e.g. Stop Loss: 1.5x ATR (6.0 pips). None when the setting is 0. |
| Auto Break Even / Trailing Stop | Only when setting 21 or 22 is above 0. Shows the profit distance that triggers it, e.g. Trailing Stop: 1.0x ATR (4.0 pips). |
| Balance | Equity | Your account balance and equity. |
| Open Trades / Open P/L | This EA’s open trades on this chart (buys / sells) and their floating profit or loss including swap (on MT4 also commission). |
| Drawdown | Only when Max Drawdown % (setting 23) is above 0. The floating loss of this EA’s trades as a % of the balance, e.g. Drawdown: 3.40% of 20.0% max. Orange from 75% of the limit, red after the limit was hit. |
| Last | The result of your last button click or automatic action, e.g. Last: Buy 0.01 lots opened, Last: 2 trade(s) closed or Last: Max drawdown 20.0% reached - trades closed. |
Chart Drawings
| Drawing | Meaning |
|---|---|
| White line | The middle line of the Turbo Scalping channel. It is the usual exit target: a buy taken at the lower band is typically closed when price comes back to the middle line, and the other way round for a sell. |
| Green line (upper band) / red line (lower band) | The channel edges. Price outside a band is stretched and may turn back. The bands use only closed and current candles, so past band values never change. |
| Green up / red down arrows | Buy and sell signals. An arrow is drawn when its candle closes and never moves or disappears afterwards. The arrow filters (settings 6-8) decide how many arrows you see. |
| Coloured rectangles | Support (green shades) and resistance (red shades) zones – areas where price turned several times before. Brighter colours are stronger zones. By default only Proven and Verified zones are drawn (settings 11-14). |
| Dashed vertical lines | News events for the pair’s currencies in the next 24 hours: red = high impact, orange = medium impact (setting 25). Point at a line to see the event name. Live charts only. |
Trade Buttons
The buttons sit in the top-right corner. They manage only the trades this EA opened on this chart (same symbol and Magic Number) – trades from other EAs or opened by hand are never touched.
| Button | What it does |
|---|---|
| LOT SIZE box (RISK % box in Risk mode) | Type the lot size (or risk %) for the next trade and press Enter. A lot size is rounded down to your broker’s lot step and kept between its minimum and maximum lot. An empty or 0 value uses setting 16 (or 17 in Risk mode). |
| BUY / SELL | Opens a market trade, then sets the stop loss and take profit from settings 19-20 (measured from the actual entry price). Example: EURUSD M5, ATR is 4 pips. BUY fills at 1.08520 -> stop loss 1.5 x 4 = 6 pips below = 1.08460, take profit 3.0 x 4 = 12 pips above = 1.08640. If your broker rejects the stops, the trade stays open without them and the panel shows stops not set (error ...). |
| BREAK EVEN | Moves the stop loss of every open trade to its entry price + 1 pip (buy) or – 1 pip (sell). Trades not yet far enough in profit for your broker’s minimum stop distance are skipped and counted in the Last row. A stop loss is never moved backwards. |
| CLOSE ALL / CLOSE BUYS / CLOSE SELLS | Closes all, only the buy, or only the sell trades of this EA on this chart at market price. |
Input Settings
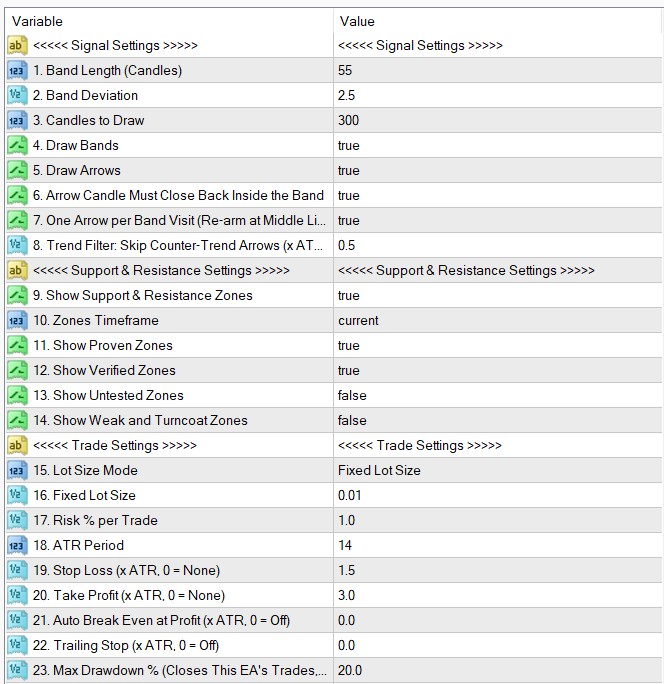
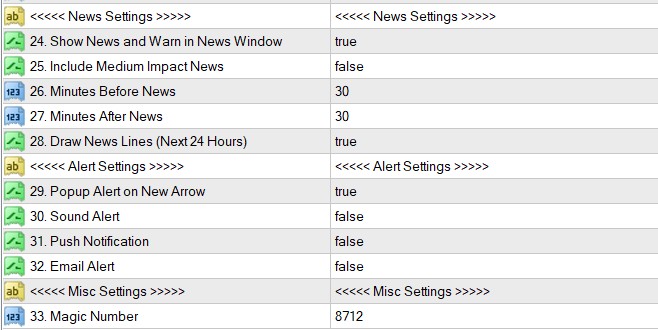
The defaults are a good starting point. Most traders only change the lot size (16) and, if they close trades at the middle line themselves, set Take Profit (20) to 0.
| No. | Setting | Explanation |
|---|---|---|
| Signal Settings | ||
| 1 | Band Length (Candles) | How many candles the channel is averaged over. Default 55. Higher = smoother, slower channel and fewer arrows; lower = faster channel and more arrows. Keep the default unless you have tested another value. |
| 2 | Band Deviation | How far the upper and lower bands sit from the middle line. Default 2.5. Higher = wider bands, price reaches them less often, so fewer but more stretched signals. Lower = narrower bands and more signals. |
| 3 | Candles to Draw | How many recent candles get the bands and arrows drawn. Default 300. Higher values show more history but make the chart heavier. |
| 4 | Draw Bands | true (default) = draw the middle line and both bands. false = hide them. The arrows and the panel keep working. |
| 5 | Draw Arrows | true (default) = draw the buy/sell arrows. false = hide them; the Signal row and alerts still work. |
| 6 | Arrow Candle Must Close Back Inside the Band | true (default) = an arrow is shown only when its candle closes back inside the channel, which confirms the turn. false = candles still closing outside the band can also give arrows (more arrows, more of them early). |
| 7 | One Arrow per Band Visit (Re-arm at Middle Line) | true (default) = after an arrow, the next arrow on the same side appears only after price has touched the middle line again. This removes the rows of repeated arrows you would otherwise see while price keeps pushing along a band. false = every qualifying candle gets an arrow. Example: a sell arrow appears at the upper band, price keeps rising and gives two more turning candles. With true you see one sell arrow; with false you see three. |
| 8 | Trend Filter: Skip Counter-Trend Arrows (x ATR, 0 = Off) | Skips arrows that go against a strong trend. The trend is measured as how far the middle line moved over the last 10 candles, in ATR (Average True Range – the average candle size over the last 14 candles, setting 18). Default 0.5. Lower = stricter (more arrows skipped), higher = looser, 0 = no trend filter. Example: ATR is 4 pips, setting 0.5 -> limit 2 pips. The middle line rose 3 pips over the last 10 candles, so sell arrows are skipped until the rise slows; buy arrows are still shown. |
| Support & Resistance Settings | ||
| 9 | Show Support & Resistance Zones | true (default) = draw the zones and show the nearest ones on the panel. false = no zones. |
| 10 | Zones Timeframe | The timeframe the zones are found on. Default “current” = the chart’s timeframe. Choose a higher timeframe for fewer, stronger zones. Example: on an M5 chart, set H1 to see the H1 zones while you trade the M5 arrows. |
| 11 | Show Proven Zones | true (default) = draw the strongest zones (tested many times). |
| 12 | Show Verified Zones | true (default) = draw zones that have been tested and held. |
| 13 | Show Untested Zones | true = also draw fresh zones that price has not come back to yet. Default false. |
| 14 | Show Weak and Turncoat Zones | true = also draw weak zones and zones that changed from support to resistance (or the other way). Default false. Turning on settings 13-14 shows many more rectangles. |
| Trade Settings | ||
| 15 | Lot Size Mode | Fixed Lot Size (default) = every trade uses the lot size in the box (setting 16). Risk % of Balance (Needs a Stop Loss) = the lot size is calculated so that hitting the stop loss loses the risk % (setting 17) of your balance. Needs Stop Loss (setting 19) above 0; with no stop loss the fixed lot size is used and the panel says so. |
| 16 | Fixed Lot Size | The lot size shown in the box when the EA is attached. Default 0.01. We recommend at most 0.01 lots per $100 of balance. Example: balance $500 -> 0.05 lots or less. |
| 17 | Risk % per Trade | Risk mode only. The % of your balance lost if the stop loss is hit. Default 1.0. Example: balance $1,000, risk 1% = $10. EURUSD stop loss 6 pips, 1 pip = $10 per lot -> $10 / (6 x $10) = 0.166 -> 0.16 lots (rounded down). |
| 18 | ATR Period | Number of candles for the ATR (Average True Range – the average candle size), read on the last closed candle of the chart. Default 14. All ATR-based distances (settings 8, 19-22) use it, so they adapt to how fast the market is moving. |
| 19 | Stop Loss (x ATR, 0 = None) | Stop loss distance from the entry price, as a multiple of ATR. Default 1.5. 0 = trades open without a stop loss (then use the Max Drawdown setting to limit losses). Example: ATR is 4 pips -> stop loss 1.5 x 4 = 6 pips from entry. |
| 20 | Take Profit (x ATR, 0 = None) | Take profit distance from the entry price, as a multiple of ATR. Default 3.0. Set 0 if you prefer to close at the middle line yourself with the CLOSE buttons. Example: ATR is 4 pips -> take profit 3.0 x 4 = 12 pips from entry. |
| 21 | Auto Break Even at Profit (x ATR, 0 = Off) | When a trade is this far in profit, its stop loss is moved to entry + 1 pip automatically. Default 0 (off). Example: setting 1.0, ATR 4 pips -> once the trade is 4 pips in profit, the stop moves to entry + 1 pip. |
| 22 | Trailing Stop (x ATR, 0 = Off) | Once a trade is this far in profit, the stop loss follows the price at this distance and never moves back. Default 0 (off). Example: setting 1.0, ATR 4 pips. A buy at 1.08520 reaches 1.08570 -> stop loss 1.08530 (4 pips below the price). |
| 23 | Max Drawdown % (Closes This EA’s Trades, 0 = Off) | When the floating loss of this EA’s trades on this chart reaches this % of your balance, all of them are closed. Default 20. 0 = off. Other charts and other EAs are not affected. Example: balance $1,000, setting 20 -> trades are closed when their combined loss reaches $200. |
| News Settings | ||
| 24 | Show News and Warn in News Window | true (default) = show the next news event on the panel, draw news lines and warn inside the news window (red panel row, arrow alerts paused). false = no news features. News is only available on live charts, not in the Strategy Tester. |
| 25 | Include Medium Impact News | false (default) = only high-impact news (and NFP) counts. true = medium-impact news also starts a news window and is shown on the panel and chart. |
| 26 | Minutes Before News | How many minutes before an event the news window starts. Default 30. |
| 27 | Minutes After News | How many minutes after an event the news window ends. Default 30. Example: USD high-impact news at 15:30 broker time, defaults -> the warning shows from 15:00 to 16:00 on USD pairs. |
| 28 | Draw News Lines (Next 24 Hours) | true (default) = a dashed vertical line at each news event for the pair in the next 24 hours. |
| Alert Settings | ||
| 29 | Popup Alert on New Arrow | true (default) = a MetaTrader alert window once when a candle closes with a new arrow, e.g. FRZ Turbo Scalping System: EURUSD M5 - BUY arrow at 1.08520. No alerts inside a news window. |
| 30 | Sound Alert | true = also play the MetaTrader alert sound. Default false. |
| 31 | Push Notification | true = send the same message to the MetaTrader app on your phone. Default false. Install the MetaTrader mobile app, copy the MetaQuotes ID from its settings and paste it in Tools > Options > Notifications. |
| 32 | Email Alert | true = send the message by email. Default false. Set up your email (SMTP) details first in Tools > Options > Email. This video shows how to do it with Gmail. |
| Misc Settings | ||
| 33 | Magic Number | An ID number the EA writes on its trades so the buttons and the drawdown stop manage only their own. Default 8712. If you attach the EA to two charts of the same pair, give each a different number (e.g. 8712 and 8713) so their Close buttons do not close each other’s trades. |
Set Files
FRZ Turbo Scalping System does not use .set files. The stop loss, take profit and other distances are ATR-based and adapt to the current market, and the lot size depends on your account balance, so a fixed .set file would not reflect the correct values for your account. Use the Input Settings table above as your starting configuration instead.
Troubleshooting
| Issue | What to check |
|---|---|
| A FRZ License – URL Not Allowed window appears and the EA is removed | https://frzserver.com is missing from the WebRequest list. Add it (see WebRequest Setup) and attach the EA again. |
| A FRZ License – Server Unreachable window appears | The license server could not be reached after 3 attempts. Check your internet connection and the WebRequest list, then attach the EA again. |
The EA is removed and the Experts tab shows Account ... is not licensed |
Your trading account number is not licensed for this product. Contact support with your account number. |
The EA does not start in the Strategy Tester: Tester license verification required. Please attach EA to a live/demo chart first. |
Attach the EA once to a live or demo chart of the same account so the license is verified, then run the backtest again. |
| Old indicators or arrows still on the chart | Remove the previous version’s indicators from the chart (right-click the chart > Indicators List > Delete). This EA needs no indicator files. |
| No arrows on the chart | Normal when price has not reached a band recently. The arrow filters (settings 6-8) also remove arrows. Check that Draw Arrows (setting 5) is true. Arrows appear only after their candle closes. |
| Fewer arrows than the old version | The old indicator recalculated past arrows, so some arrows appeared or disappeared after the fact. This version draws an arrow only once its candle has closed and never changes it, and the default filters skip repeated and counter-trend arrows. Set settings 6-7 to false and 8 to 0 for more arrows. |
The buttons do nothing / Last: Buy failed, error 4109 (MT4) or a retcode (MT5) |
AutoTrading / Algo Trading is off, or live trading is not allowed on the EA’s Common tab. Other numbers come from your broker, most often not enough margin, the market is closed, or trading is disabled for the symbol. |
..., stops not set (error ...) |
The trade opened, but the broker rejected the stop loss / take profit, usually because a level is too close to the price. Set them manually in the trade’s Modify window. |
Next News: No upcoming news for a long time |
Normal when no high-impact event is scheduled for the pair’s currencies this week. If news never appears, check that https://frzserver.com is in the WebRequest list. |
| Nothing is drawn in the Strategy Tester | Drawings and the panel only appear with Visual mode ticked. The buttons, news and alerts do not work in the Strategy Tester. |
| Settings look wrong after updating the EA | MetaTrader can keep old input values when a new version is attached. Remove the EA from the chart, attach it again and click Reset on the Inputs tab before changing any setting. |
Get Support
Online AI chat: https://t.me/FRZSupportBot
Discord Forum: https://www.frzsoftware.com/discord
Useful Links
Recommended VPS: https://www.frzsoftware.com/getvps
Join VIP Club: https://www.frzsoftware.com/vipclub
Social Links: https://www.frzsoftware.com/socials
Disclaimer
Our software is provided “as is”, without any warranty or condition of any kind, express, implied or statutory. You are advised to do necessary testing on demo accounts before using the software on a live account. Trading carries a high level of risk to your capital and you should only trade with money you can afford to lose. Past performance of any trading system is not necessarily indicative of future results.